Progress Report! Day 19 of 70
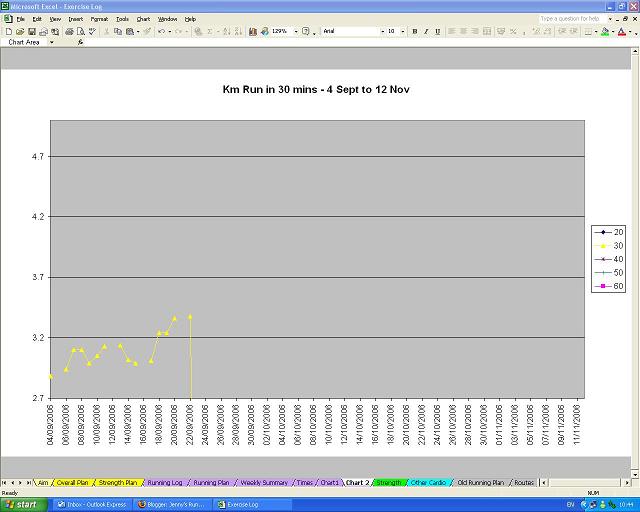
I'm hoping that the above jpg is readable, but if not here's the essentials! This chart shows the kms covered in my 30 minute sessions. It shows all of my runs on there since I started my programme 19 days ago and the important thing is that there's an upward trend - hooray! I should add that the end of the chart is the end of my 10 week programme so I'm hoping to be hitting around 4 kms. Hmmm... I should adjust the scale. That doesn't seem right though - looking at the chart it looks like I'd be able to run further than that but if I work it out in my head - run 30 mins at 8 km/h - then it's right. Not sure.
posted by Jenny at
10:35 AM
![]()


2 Comments:
Not too bad. Maybe next time hide the bottom bar......or cut out the bit you need in paint.
Appart from that very good!
By Anonymous, at 11:27 AM
Love charts!!!
By Unknown, at 1:51 PM
Post a Comment
<< Home